Some of the best run apartment buildings in America are writing checks to refinance. Being full is not the same as being financeable.
Ninety five percent occupied. Rents on plan. Clean operations. And the owner still has to write a check to refinance.
That is the situation a lot of stabilized workforce housing is in right now. The building did everything right. The permanent loan still comes in smaller than the loan it has to pay off.
Occupancy tells you the building works. It doesn't tell you how much debt it can carry.
Three tests, one answer
A permanent lender sizes a loan against several limits at once and takes the lowest. We wrote about the coverage math in How to Calculate DSCR for Multifamily Property. Here is how the tests interact.
Loan to value. A percentage of the appraised value. Agency lenders go to 80% on paper, though most loans close well below that.
Debt service coverage. NOI divided by annual debt service. The agency minimum is 1.25x at higher leverage and 1.35x at 65%. CBRE's Q2 2026 data shows actual closed loans averaging 1.43x.
Debt yield. NOI divided by the loan amount. Agencies don't formally use it. Banks, CMBS and life companies do, and 9% to 10% is a common floor.
When rates were low, loan to value was usually the binding test. Today coverage almost always binds first. The appraisal can say one thing and the payment math says another.
A worked example
Take the same illustrative 40 unit building from our last piece. It has a $3.6 million bridge loan coming due. NOI is $320,000. The lender underwrites it at $305,000 after its own vacancy and reserve assumptions.
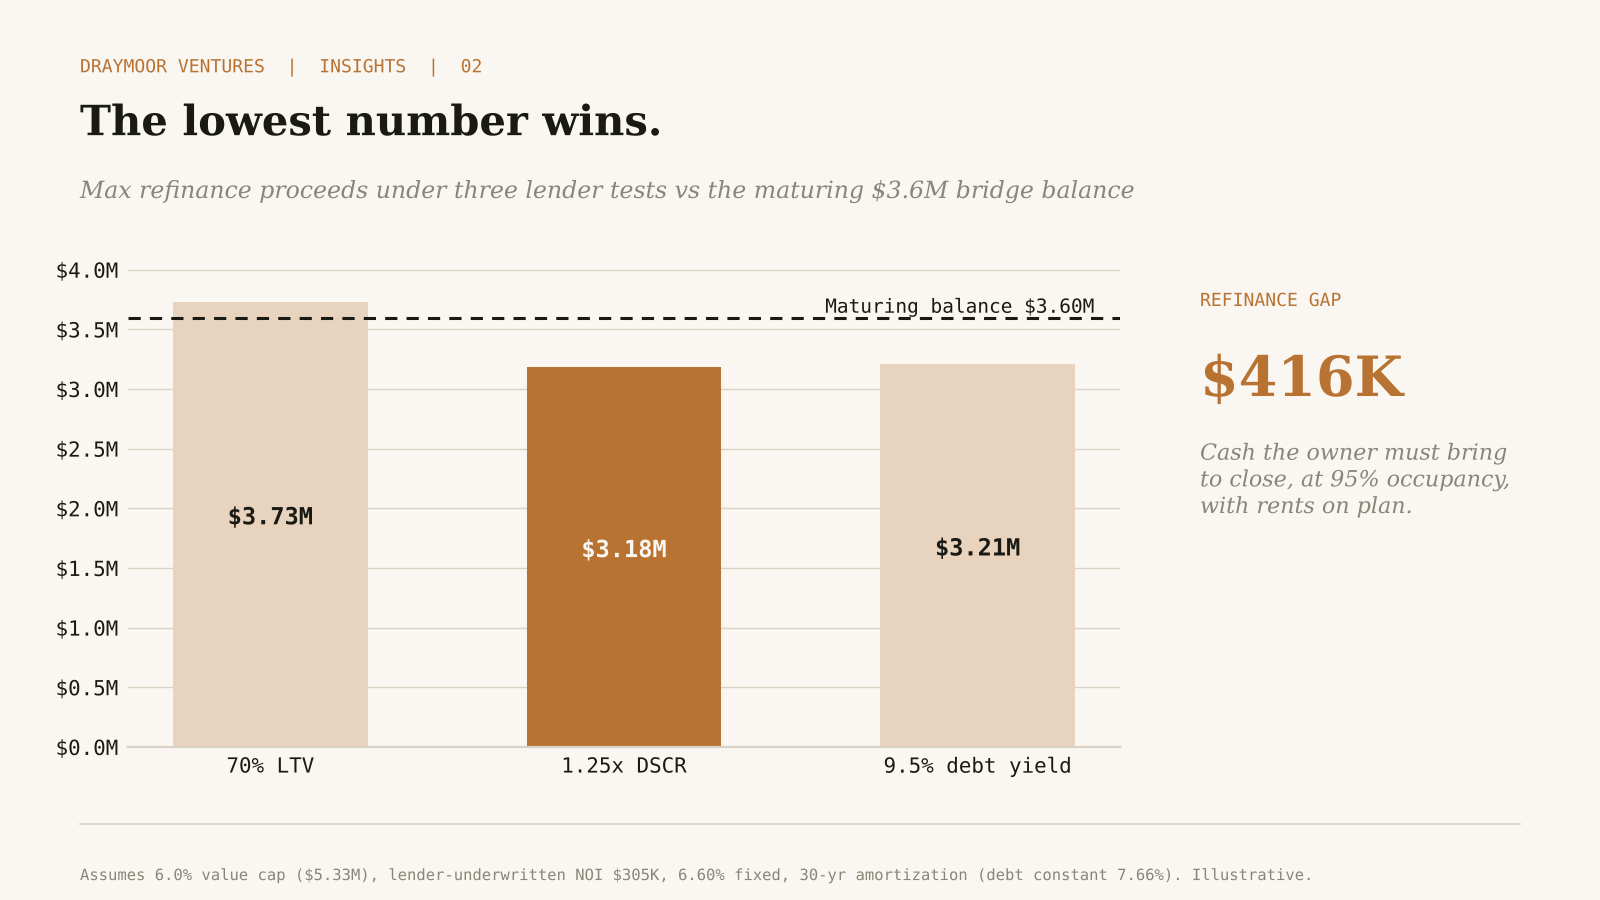
At a 6.0% cap rate, the building appraises around $5.33 million. Seventy percent of that is $3.73 million. On loan to value alone, the refinance pays off the bridge with room to spare.
Now run coverage. At a 6.60% fixed rate on 30 year amortization, every dollar of loan costs about 7.66 cents a year. At 1.25x on $305,000 of NOI, the maximum loan is about $3.18 million. A bank sizing to a 9.5% debt yield lands near $3.21 million.
The lowest number wins. The owner needs about $416,000 of new cash to close.
Why the same test is harder at home
We live in Orange County. The coverage test is the same everywhere, but the cap rate it gets applied to is not. Orange County apartments trade around a 4.9% cap rate. The national average is 5.79%. Indianapolis runs 6.0% to 6.5%.
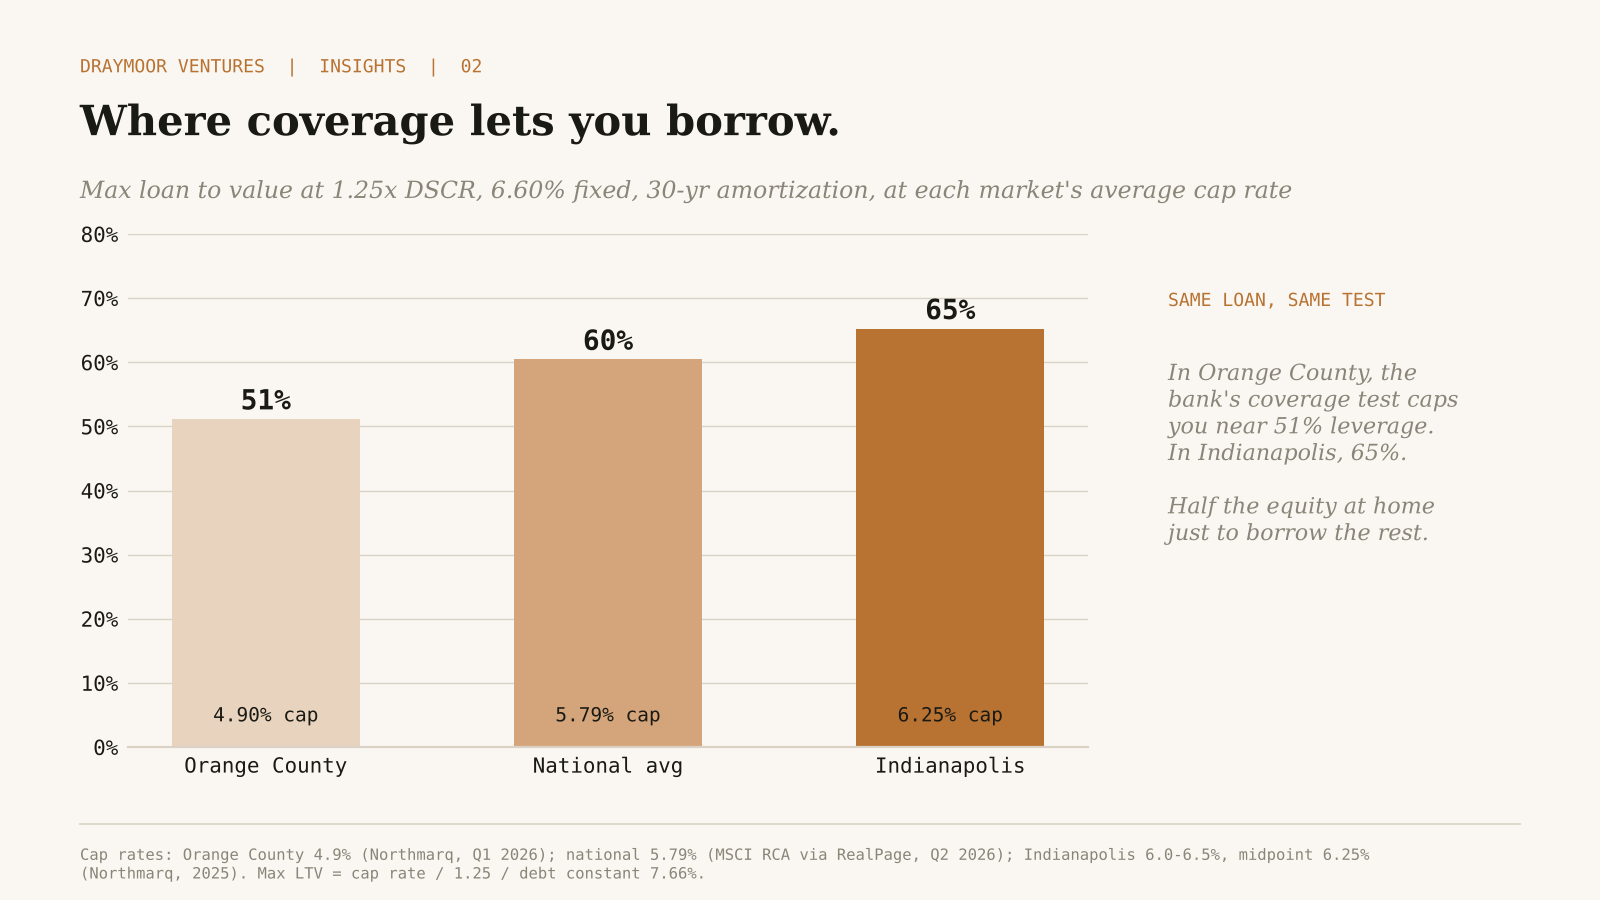
Run each market through the same 6.60% loan at 1.25x. In Orange County the test caps leverage near 51% of value. Nationally it is about 60%. In Indianapolis it is about 65%.
A California buyer needs roughly half the price in cash before a lender will fund the rest. That is a big part of why we invest out of state.
Where the gap comes from
The gap isn't a sign of a bad building. It comes from three things that moved at once.
Rates. In early October 2026 the 10 year Treasury was around 5.2%, up from about 4.4% in the spring, and agency 10 year fixed rates ran roughly 6.3% to 7.0%.
Underwritten NOI. Lenders haircut actual NOI for vacancy, management and reserves. The number they size to is lower than the number on the owner's statement.
The starting loan. A bridge sized at 75% of a 2021 purchase price assumed a 2021 exit.
What we do with it
When we underwrite an acquisition, we run the refinance gap before we make an offer, even though we don't plan to sell. Two reasons.
First, it shows us how much equity a deal really needs over its life, not just at closing. Second, when we're buying from an owner facing this gap, it shows us what the seller is really up against. That makes for a more honest conversation about price.
Our rule
We size our own debt to coverage, not to the appraisal. If a deal needs every dollar of a loan to value number to work, we treat it as overleveraged on day one. We start at 1.25x coverage on trailing numbers and we leave room for rates to stay where they are.
Bring us the real numbers
If you're an owner or broker working through a refinance gap on a 4 to 70 unit property, send the T12, rent roll and maturity date to steven@draymoorventures.com. We'll tell you plainly whether we're a fit.
Source and data note
Agency DSCR and LTV limits: Northmarq current rates and Lument Fannie Mae Small Loan term sheet, October 2026.
Closed loan averages: CBRE Lending Momentum, Q2 2026.
10 year Treasury: U.S. Treasury daily yield curve, October 8 to 9, 2026.
Market cap rates: Northmarq Southern California Q1 2026 (Orange County 4.9%), MSCI RCA via RealPage Q2 2026 (national 5.79%), Northmarq Midwest 2025 (Indianapolis 6.0% to 6.5%, midpoint used). The 40 unit property, cap rate and underwritten NOI are illustrative.